

Menu

Definitions about Air Cleaners
INDOOR AIR QUALITY
Indoor air is polluted by more than two thousand polluting agents. Cigarette smoke contains over 600 toxic components. Other polluting sources also include mites in homes, pollen dusts, mold spores, pesticides, dyes, solvents, cleaning materials and pets kept in home. Organic and inorganic particles and volatile organic compounds (VOC) also pollute the indoor air. In the past, infiltration of normal outdoor air was a contributory factor to reduce pollution. However, the high costs of energy expenditures in 1970s naturally required insulation for all types of structures and buildings and so it lessened the effect of outdoor air infiltration which was regarded as positive. Consequently, air pollutants above the normal level and posing high risk for health because of high concentration levels have resulted in health problems. Therefore, the term of Sick Building Syndrome took part in the literature as a concept defining the excessive level of the concentration of indoor air pollution.
EFFECTS OF POOR INDOOR AIR QUALITY ON HEALTH
Poor indoor air quality commonly causes various physiological problems such as allergic reactions, headache, nausea and nose, throat and lung irritation. It commonly causes discomfort and fatigue as well. Poor indoor air quality actually harms the immune and defense system of body, thereby resulting in loss of energy and efficiency. Scientists are still studying on the long term effects of poor indoor air quality. Children and old people and those with immune and respiratory system diseases (asthma, emphysema, allergic diseases) are in a high-risk group. Nobody is immune to high level effects of toxic materials. Sub-standard air quality makes everybody uncomfortable for all times and under any circumstances.
METHODS FOR IMPROVING THE POOR AIR QUALITY
There are three specific ways to improve indoor air quality:
1. Elimination of pollutants at source,
2. Ventilation with fresh air supply
3. Air cleaning
1. Elimination of pollutants at source may only be possible by limiting the emission of specific compounds into air or removing them throughly from the ambient air. (Not to allow for smoking and prevent the growth of mold and bacteria by decreasing humidity)
Construction materials and varnishes are potentially harmful emitters. Harmless materials that will take the place of harmless ones are being developed. However, the increase of indoor air pollution persists for years in terms of currently used materials and new varnishes.
2. Ventilation with fresh outdoor air enables the pollutants to purify and reduce to a certain level. But, the said process is only possible when outdoor air contains far less pollutants than indoor air. In order to identify the indoor air quality problems, relevant description of ASHRAE (American Society of Heating Refrigeration Air Conditioning Engineers) is as follows: Standard flow of fresh air should be considered between 5 and 15 cubic feet (cim) in an office environment per minute. Also, ASHRAE standard for home environment is 0.35 air exchange rate per hour.
Moreover, air conditioning and heating systems require extra power for air cleaning to be made by means of ventilation process and thus increasing the energy costs.
3. Air cleaning means the removal of airborne pollutants from indoor air concentration. Air cleaners are able to remove a certain rate of pollutants in a specific period of time. Extraction rate of polluting elements from the air concentration shows the efficiency of air cleaning device. Air volume subjected to air cleaning process is sized as cubic feet per minute or m c i re cubic. For example, an air cleaner whose volume of make-up air is 75 cfm (cubic feet per minute) prepares the airborne pollutant concentration by mixing with a concentration of 75 cfm for fresh air. The pollution of indoor air means the supply of mixture that eliminates the concentration. The said air cleaner dilutes the pollution of indoor air by supplying fresh air with 125 cubic meter/hour on metric units.
THE IMPORTANCE OF PARTICLE SIZE FOR THE DETERMINATION OF THE EFFICIENCY OF AIR CLEANING DEVICE
There are three reasons why air cleaning efficiency is determined by applying the 0.3 micron of DOP test.
1. The particles of 0.3 micron are respirable particles which are commonly accumulated on lumps.
2. Lee and B.Y.H. Liv from Minnesota University announced in 1980 that the particles of 0.3 micron are the most difficult particles to filter through the air flow.
3. Different test methods other than DOP test give less concrete results in comparison with DOP test for capture efficiency of respirable particles. Filtration of particles, larger or smaller than 03 micron, is easier than the particles with the size of 0.3 micron. The best indicator to show and define the filtration efficiency and capacity of a filter is to test with the particles of 0.3 micron. DOP (dio clyphthalete) known as testing the filtration efficiency of particles with the size of 0.3 micron is carried out with particles of 0.3 micron generated as a result of thermal based increase and the said test is an excellent indicator to show the efficiency of filter.
WHAT DOES THE EFFICIENCY OF AIR CLEANING DEVICE MEAN?
Air cleaners are the devices that remove a certain rate of pollutants from the air thus cleaning the ambient air. RSP stands for Respirable Suspended Particles and means the respirable particles in the air. This efficiency is defined as the percentage rate of RSP particles of 0.3 micron, extracted from the air, and volume of incoming air. The most reliable indicator to compare the air cleaners is Clean Air Delivery Rate (CADR). CADR consist of net air volume, which is the output of air cleaning system and minimum filtration efficiency based upon the DOP test of 0.3 micron. It is stated that an air cleaner (1680 cubic meter / hour) that will remove 95% of 0.3 micron particles from the 100 cubic feet (26.6 cubic meter) air in a minute requires 95% of DOP filter.
In summary, 1596 cubic meter fresh air is obtained within a hour if 95% fresh air is obtained from the air of 1680 cubic meter / hour. If it is kept in mind that it means 100 cubic feet or 26.6 cubic meter fresh air per minute, it is obtained that 1596 cubic meter / 60 min. = 26.6 cubic meter / min. . The same result may be obtained from an air cleaner with 190 CFM (3190 cubic meter / hour) and 50% efficiency rate (based on 0.3 micron)
The efficiency of odor, fume and gas accumulation function and absorbing capability resulting from the vapor and absorbing surface included in the ambient air of 3190 cubic meter / hour x 0.5 = 1595 should be considered as time-based function. Temperature, humidity and odor are the other factors affecting the efficiency.
THE EFFECTS OF AIR FLOW CHARACTERISTICS ON AIR QUALITY
Fresh air can be discharged from the air cleaner in a single direction (laminar air outlet) or omni directionally. It is possible to form dead zones in the room for laminar air flow and the air of said zones remains stable and resists to have polluting elements. Fresh air flow and the polluting level in the air are lowered homogeneously for air cleaners equipped with omni directional flow system. Omni directional flow eases the flow of dirty air to air cleaning device and inlet area of device by building up a low pressure on the unit.
TYPES OF AIR CLEANERS
Air cleaners are grouped under four headings:
1. Air cleaner with mechanic filter
2. Air cleaner with electrostatic filter
3. Electrostatic precipitator
4. Ionizers
Short description on these types are given below;
1. Mechanic Filtration Type:
Fiber or foam type filters eliminate the airborne particles by means of filtering. The said devices have not any electronic mechanism and their efficiency level does not decrease after being used for a specific period of time. Capturing efficiency of Respirable Suspended Particles (RSP) is spread from 2% as standard stove filters to 99.97% like HEPA filters.
2. Electrostatic Filters:
They are fitted into static electric charge by means of plastic fibrous or strain filters or they provide electrostatic charge with air outlet. This electrostatic charge attracts and captures the particles as if they were passing through a filter. Efficiency of RSP ranges from 7% to 97%.
3. Electrostatic Precipitators:
These systems include two steps: In the first step, the air is ionized by a high voltage point or cable so that particles are charged. In the second step, air passes through the charged metal plates at the time of high voltage and thus charged particles are separated from the air by method of extracting.
RSP efficiency of such devices lowers after collection plates are polluted. Starting efficiency is considered as almost 95% but it decreases up to 20% depending on operation time (for example 40 hours of operation causes the said decrease) Starting efficiency can be achieved again by cleaning the collector plates. It should be ensured by periodical maintenance.
4. Ionizers:
These units ionize the air and clean the particles with electric charge. However, they do not have secondary stage collector plates in a similar way with electrostatic precipitator types. Charged particles are separated from the air and stick to the nearest surface charged with electricity. It is very similar to the process of painting a wall. Naturally, the said situation causes a pollution problem and poses the risk of mixing the particles into air again due to the loss of static charge in particles. No recorded RSP data is available for such kind of devices. Also, such devices sometimes cause ozone generation at insecure levels.
PERFORMANCE TESTS OF AIR CLEANING DEVICES AND TEST RESULTS
1. Robens Institute of Health and Safety (England) :
An air cleaner, selected for the said purpose, was tested by Robens Institute of Health and Safety (England). Test was conducted in a closed room of 20 m3 to determine the effects of smoking. Three different tests were carried out for this scope: One of these tests is to monitor the change of particle concentration for 30 minutes without filtration, and particle concentration of other device under minimum and maximum operating conditions. Test results are shown in Figure 1.
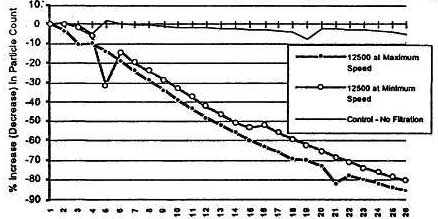
Figure 1:
When the device is operated with maximum speed, total amount of particle was recorded as 85.7%. The recorded particle elimination under minimum speed capacity was 80.8%. On the other hand, the maximum decrease of total particle amount in the air was detected as 4.7% in the control test without filtration or with the air circulation out of device. These measurements were made on the basis of total particle amount after smoking a cigarette and before starting the device.
2. Test Carried Out Under A Working Environment:
The said test was carried out in the office or typical working environment in order to determine the effects of cleaning. Test space has an irregular layout and is fully furnished. Total volume is 57.5 cubic meter (2.014 cubic feet) and the area covered with carpet is 27 m2 (291 square feet) Office layout is shown in Figure 2.
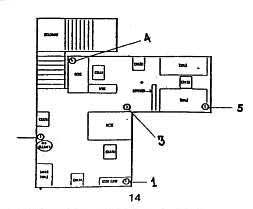
Figure 2:
One portable particle counter was kept available for counting the particles of 0.3 micron or larger. Five sample sites were selected: The devices were positioned at three different height levels. Air cleaners were placed on the floor (3), at medium height (2) and on ceiling (1,4 and 5), respectively. Two of them were noticeable (1 and 2), the other two were hidden by walls (4 and 5) and one of them was positioned at the back of furnitures (13). Particle count was firstly measured as the precipitation of normal particles just after starting to smoke for 30 minutes. Following the natural precipitation, cigarette smoke was added into the ambient air and particle concentration level was kept at the same level for starting the control test and then measurement of particle count was recorded for each minute within half an hour under the maximum speed operation of air cleaning device. Also, another measurement was made after 40 minutes operation of air cleaner. During the tests, office doors and vents were closed. Air cleaners were arranged randomly. Maximum operating performance of other elements were not considered at this phase. These results were taken by positioning the devices nearby power sockets. Particle count decreased 12% in average without making filtration for 30 minutes (normal precipitation) (maximum decrease was 18% and minimum decrease was 8%) Decrease in the particle amount was 69% after the operation of air cleaning device for 30 minutes (79% in maximum and 62% in minimum) The ratio of decrease in the particle amount was 80% after air cleaning device was operated for 40 minutes (76% in maximum and 76% in minimum) These results are shown in Figure 3.
It is clearly seen from the design and test results that eliminated amount of pollutants during the operation of air cleaners is much higher than normal precipitation process. Another result is that the cleanness level in covered and limited areas reaches to the similar level with the uncovered and unlimited devices during the time period of 5-7 minutes. It is concluded from the study that decrease in the particle count is almost equal to each other for all areas.
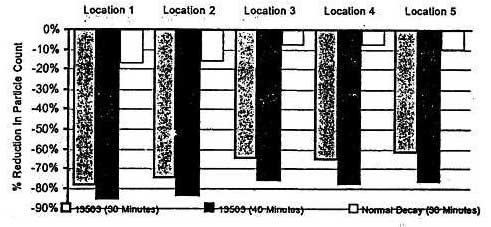
Figure 3
SOURCE
It was compiled from the publications of Honeywell Air Cleaners Sales & Applications Information
I. Deniz YILDIRIM
graduated from Yildiz Technical University, Faculty of Mechanical Engineering and began his career at the Production Planning Department of Alarko Sanayi ve Ticaret A.S. He worked in the Planning and Product Management Departments of STFA Sedef Gemi Endüstri A.S. and Erensan Isi Sanayi A.S., respectively. He has been working on Housing Control and Automation for two years in Honeywell A.S. He was born in 1965 in Istanbul and speaks English fluently.